methnen

Forum Replies Created
-
Forum: Plugins
In reply to: [M Chart] Not saving data in WP back-endI did, I’ve had it on my list to take a look at but my paying work life has been a little overwhelming the last few weeks and I hadn’t managed to get to it yet. I sent you a reply a few moments ago.
- This reply was modified 1 year, 2 months ago by methnen.
Forum: Plugins
In reply to: [M Chart] Not saving data in WP back-endHard to say. My guess would be that something else is interfering with the Javascript though.
The first thing to check would be to open up the browser console and look for any Javascript errors inside of the console when you are using the plugin. Most typically you’ll see a TypeError of some kind.
I’m also happy to take a look at this myself in action if you have a way to share some credentials or access to a dev environment that replicates your setup. Whatever works best for you.
I’m available via email at jamie AT methnen.com but please ping me on here when you send the email so I know to look for it.
Forum: Plugins
In reply to: [M Chart] Is Front-edit possible?Not really. The live preview functionality is driven through an admin Ajax endpoint that’s not available from the front end. And there’s a bunch of additional scripting that handles pushing the changes to the chart that are also not available from the front end.
I’ll admit it’s also something I don’t have any plans to implement at this point.
Forum: Plugins
In reply to: [M Chart] It’s grayed out and I can’t save.Marking as resolved due to lack of response from OP.
Forum: Plugins
In reply to: [M Chart] Chart with horizontal scroll and data exportFor a fully functional/stylable and still accessible scrollbar I’ve had good experiences with this one in the past:
https://github.com/bitshares/perfect-scrollbar
- This reply was modified 1 year, 4 months ago by methnen.
Forum: Plugins
In reply to: [M Chart] Chart with horizontal scroll and data exportI would imagine so but, I’ll admit I’m not really in a position where I could afford the time a the moment.
Just a bit too much going on personally and professionally at present to be confident I could do it in a timely manner without sacrificing something I can’t really afford to sacrifice.
I do have a suggestion of something to try though… that’s occurring to me as I think through it in a bit more detail and it’s a pretty easy (potentially) solution.
Just as a though experiment, wouldn’t putting and overflow-x: auto on the container div of the chart.js chart and then setting a width that’s some multiple of the number of columns be somewhat of a solution for this?
You’d end up with the chart rendered quite wide so it would be still readable and a horizontal scroll would reveal the rest and you could style that up to provide indicators that there’s more off screen and/or use a custom scroll bar to handle the interface in an accessible way as well.
Obviously you’d need to try it to confirm, but just thinking out loud, I think that could work without actually needing to do any custom Chart.js stuff. All you’d need is some fairly simple JS or jQuery code to insert itself under the chart when it renders (there’s some hooks for that) and then modify the containers as needed to set the widths and overflow value if necessary.
Forum: Plugins
In reply to: [M Chart] Chart with horizontal scroll and data exportQ1: Probably but it would involve hacking Chart.js to do something other than it’s default behavior. This is pretty far out of scope for what the plugin itself is intended to do.
Q2: There’s no mechanism for this and it’s not an intended usage. The idea, generally speaking is that you manage the data inside of M Chart going forward. The individual CSV import/export is there for convenience of getting a chart’s data in and out of the system, but there’s no mechanism for a bulk import export and none planned.
Forum: Plugins
In reply to: [M Chart] It’s grayed out and I can’t save.What you’re describing is usually the result of some sort of JS error that’s killing things.
I’m happy to take a look directly, but the first thing to check would be to look inside of the browser console and see if there’s any errors appearing there.
Forum: Plugins
In reply to: [Smart Slider 3] Having an issue with a slider on my homepageAh, thank you. So it’s just that the CSS that controls the look/feel of the slider is not loading and returning an error sometimes.
The site is hosted at wordpress.com, I’ll get in contact with them to see if they can identify the issue.
I really appreciate the quick response.
Forum: Plugins
In reply to: [M Chart] Added colors for axes. AlmostAwesome. I replied to you in the pull request comments.
Forum: Plugins
In reply to: [M Chart] Added colors for axes. AlmostI can’t see what you did so I can’t tell what might be wrong.
Do you have your code as well as a place I can see this in action?
Forum: Plugins
In reply to: [M Chart] How to make a hyphenation in the title?Forum: Plugins
In reply to: [M Chart] How to make a hyphenation in the title?Those are line breaks. Not hyphenations.
And there isn’t a way.
I mentioned in another thread that SVG and Canvas text handling is atrocious. And this is an example of that playing out.
To create a new line of text in Canvas or SVG you actually have to create a separate text object and then position below the previous line of text.
I convinced the Chart.js developers to add the subtitle functionality specifically to provide a way to somewhat deal with the issue. Thus why I recommended reformatting your titles to provide a shorter main title with longer/additional info in the subtitle field.
Forum: Plugins
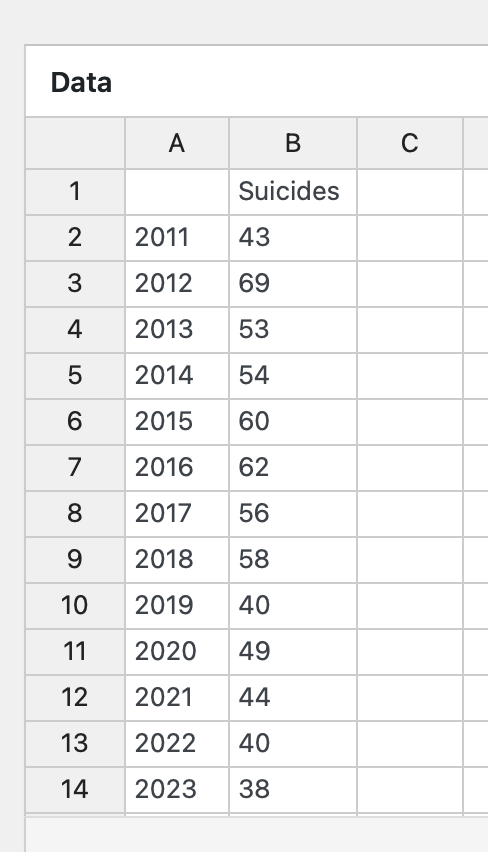
In reply to: [M Chart] How make chart by Years ?Yes, that’s why I was saying add it in and I think it will work.
I believe, what’s happening is that the plugin is getting confused because there’s only numbers in all of the cells. So it’s having trouble deciding what is a potential label and what isn’t.
Adding the label to the first row fixes this.
I’ll have to figure out if I can think of an efficient way to fix this longer term.
Oddly enough I think you might be the first person who’s ever brought this up.
Forum: Plugins
In reply to: [M Chart] How make chart by Years ?OK, so there’s something going on here that I’m not immediately positive on.
But try formatting the data like this with a label on the first row for the data set:
https://methnen-dropshare.s3.amazonaws.com/pb-67EyrN3kYB.png
Let me know if that solves the issue you’re having?